Birkdale 4159 · 2 November 2026
Your Birkdale Three Month Wrap
August
17 sales
September
12 sales
October
5 sales
Follows the Three Month Wrap (July to September)
Prepared by
Daniel Gierach · Ray White · The Collective
Thirty-four properties changed hands in Birkdale across August, September and October 2026. These are the sales, the streets and the prices that defined the quarter.
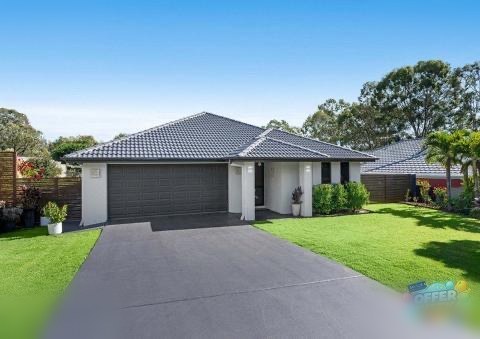
The quarter’s second-highest sale 14 Amalia Street · $1.4m
The quarter in short
The median house in Birkdale sold for $1.11m this quarter, while the median unit/townhouse sold for $846k. A typical sale took 43 days from listing to contract. Three of the 34 sold with their prices undisclosed.
Near your property
The sales closest to your property.
What does this mean for the value of your home?
The gallery
Some of the quarter’s top sales.
14 Amalia Street
$1.4m
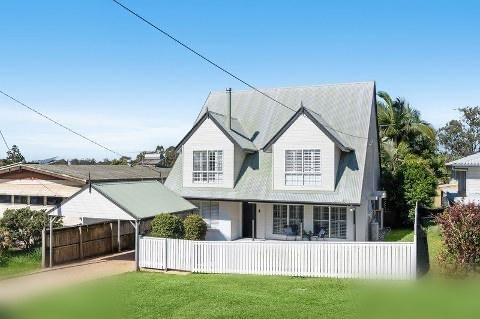
19 Roger Street
$1.39m
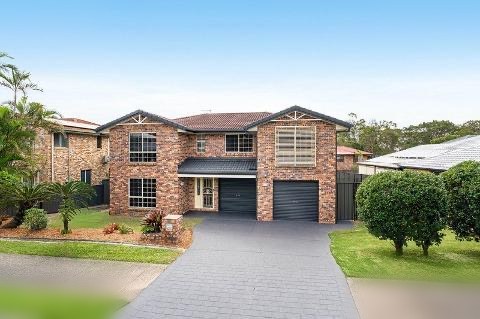
58 Burbank Road
$1.33m
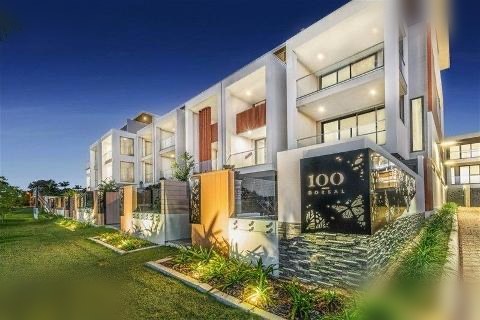
17/100 Dorsal Drive
$1.31m
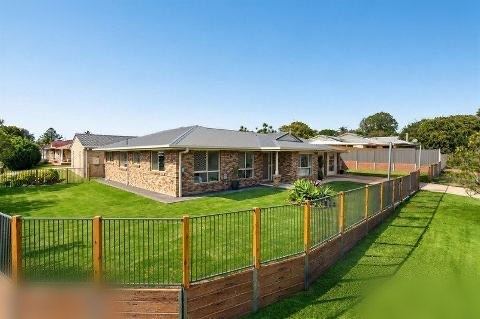
7 Almond Avenue
$1.3m
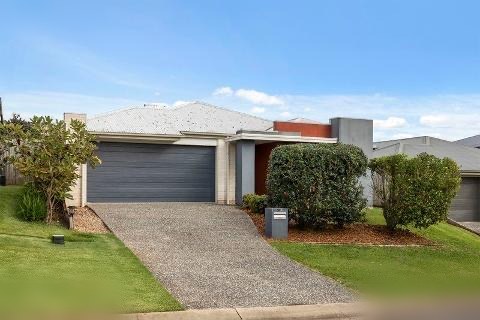
21a Lynch Crescent
$1.2m
Six of the 34 sales this quarter. Every sale is in the list below.
The record
Every sale this quarter.
Where the sales were
House Unit
Open in Google Maps ↗ Around Birkdale
What’s happening in the surrounding suburbs.
The same quarter’s sales in the four suburbs closest to Birkdale. Tap one for its full report.
Thorneside 11 sales Median prices, August to October House$1.45mUnit/townhouse$710k See the report Wellington Point 25 sales Median prices, August to October House$1.26mUnit/townhouse$855k See the report Thornlands 40 sales Median prices, August to October House$1.17mUnit/townhouse$775k See the report Ormiston 15 sales Median prices, August to October House$1.48mUnit/townhouse$805k See the report
What does this mean for the value of my home?
Contact Daniel Gierach
0412 523 821 · daniel.gierach@raywhite.com


The people behind this report · Meet your team